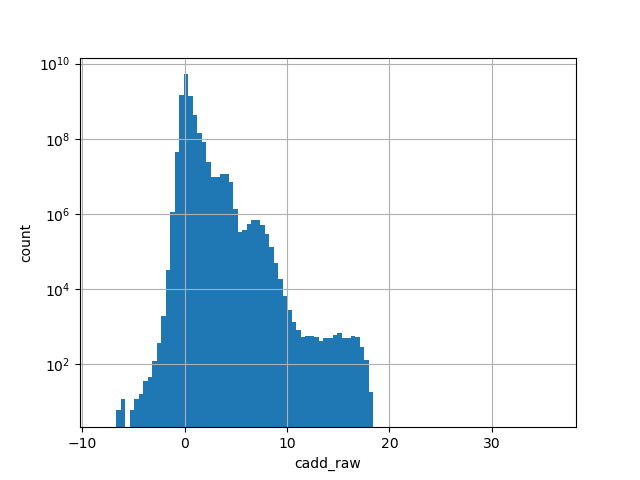
cadd_raw

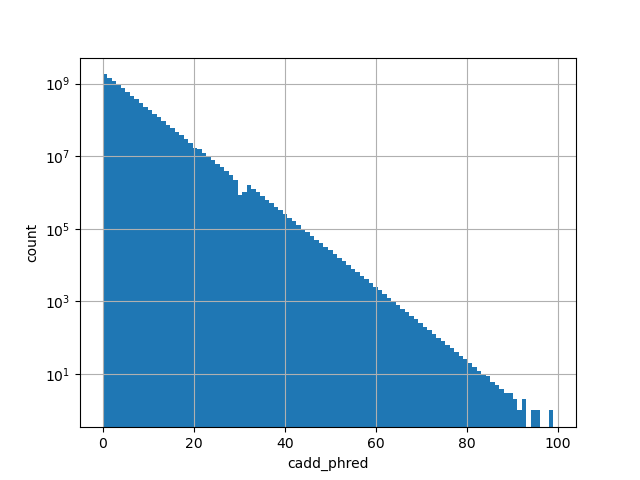
cadd_phred

| Id: | hg38/scores/CADD_v1.4 |
| Type: | allele_score |
| Version: | 0 |
| Summary: |
CADD (Combined Annotation Dependent Depletion score) predicts the potential impact of a SNP |
| Description: |
CADD GRCh38-v1.4CADD score for functional prediction of a SNP. Please refer to Kircher et al. (2014) Nature Genetics 46(3):310-5 for details. The larger the score the more likely the SNP has damaging effect. Downloaded from https://cadd.gs.washington.edu/download ; Higher values of raw scores have relative meaning that a variant is more likely to be simulated (or "not observed") and therefore more likely to have deleterious effects. Scaled scores are PHRED-like (-10*log10(rank/total)) scaled C-score ranking a variant relative to all possible substitutions of the human genome (8.6x10^9). Please note the following copyright statement for CADD: "CADD scores (http://cadd.gs.washington.edu/) are Copyright 2013 University of Washington and Hudson-Alpha Institute for Biotechnology (all rights reserved) but are freely available for all academic, non-commercial applications. For commercial licensing information contact Jennifer McCullar (mccullaj@uw.edu). |
| Labels: |
|
| ID | Type | Default annotation | Description | Histogram | Range |
|---|---|---|---|---|---|
| cadd_raw | float |
cadd_raw |
CADD raw score for functional prediction of a SNP. The larger the score
the more likely the SNP has damaging effect
Small values desc: less damaging
Large values desc: more damaging
|
 |
[-6.46, 18.3] |
| cadd_phred | float |
cadd_phred |
CADD phred-like score. This is phred-like rank score based on whole
genome CADD raw scores. The larger the score the more likely the SNP
has damaging effect.
Small values desc: less damaging
Large values desc: more damaging
|
 |
[0, 99] |
| Filename | Size | md5 |
|---|---|---|
| genomic_resource.yaml | 2.47 KB | 576e0e4c585a874a4f43d30c501a3a4c |
| histograms.old/CADD_phred_gs | 1.47 KB | 6908692b779bee7c046db934802ad679 |
| histograms.old/CADD_phred_gs.md | 393.0 B | 7ab7293577e327d484a8b164e3fea70b |
| histograms.old/CADD_phred_gs.png | 17.32 KB | 0f1c2ccd4ed7def8fbf4de8f9bb2ac52 |
| histograms.old/CADD_raw_gs | 2.2 KB | 4678193de8f0ca876ce207807f13e1d3 |
| histograms.old/CADD_raw_gs.md | 390.0 B | 884f20ec32d4b7073b44164ac69ba167 |
| histograms.old/CADD_raw_gs.png | 16.9 KB | eee6a728841d28d4be2aaed5af39a1c3 |
| whole_genome_SNVs.tsv.gz | 79.42 GB | c33f623e3a06e07c1d3084ef56b1dd5a |
| whole_genome_SNVs.tsv.gz.dvc | 99.0 B | e939fe34a4c17f94a45293ba32e76f9a |
| whole_genome_SNVs.tsv.gz.sha256 | 91.0 B | 8cc8a9f5d28923cde75210df1eb8a89b |
| whole_genome_SNVs.tsv.gz.tbi | 2.64 MB | 3e45a956b3cc29d00ad21e50f32537b7 |
| whole_genome_SNVs.tsv.gz.tbi.dvc | 99.0 B | b25cc3fda37030edd4ee835e80e366ef |
| whole_genome_SNVs.tsv.gz.tbi.sha256 | 95.0 B | ca1708a6ed8268d7f4c1b44449f4e434 |
| statistics/ |